I can always hear a resounding sigh from my students whenever I assign flowcharts to them before an experiment. Science flowcharts help students understand the procedure before any experiments. They are graphical representations of the scientific inquiry process. They show that the process of scientific inquiry is not linear, and is iterative and dynamic. I assign this task before every experiment so my students can come to the lab prepared, understanding how to iterate the procedure, what equipment is needed, what needs to be collected, etc. But many students lament as they feel as though they're not "artistic" enough to visually represent flowcharts in a beautiful way.
This is when Shapes in Keynote comes in.
I like assigning this activity using Keynote instead of the regular draw-your-flowchart-by-hand-on-a-piece-of-paper activity as it provides my students a glimpse into researchers’ workflow. It also empowers them as creators because regardless of their artistic capabilities, they, too, can create beautiful flowcharts that are easily understandable.
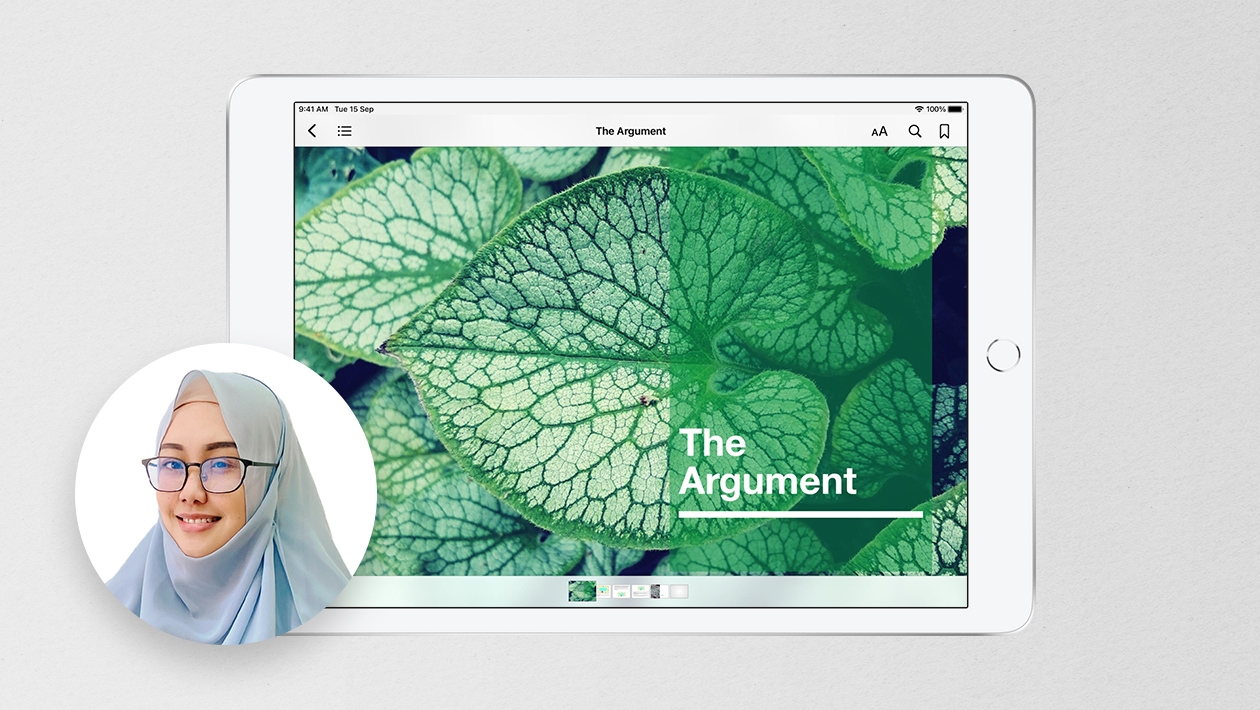
HOW: When I assign this to my students, I provide this template as an exemplar for my students and also show my students how to combine Shapes to create scientific drawings that are appropriate to the experiment.
There are so many cross-curricular application with this assignment. I find that when my students realized how powerful it is for them to create personal, meaningful images using Shapes, they apply the same skill into other disciplines. I even have students using Shapes to create lab safety posters for the classroom as well! The possibilities are limitless, let your students explore and they'll show you what they can do.
QUICK TIP: Grouping Shapes together helps create images that are specific to the circumstances, like in this case, combining lines to form crosses to indicate pencil drawn lines on chromatography paper.
Learn how using the Everyone Can Create Project ‘Design With Shapes’
What other creative ideas do you have for how students can use Keynote to build science literacy?


September 14, 2022 . English
I could see this as being turned into a great gif as well!
This action is unavailable while under moderation.
This action is unavailable while under moderation.