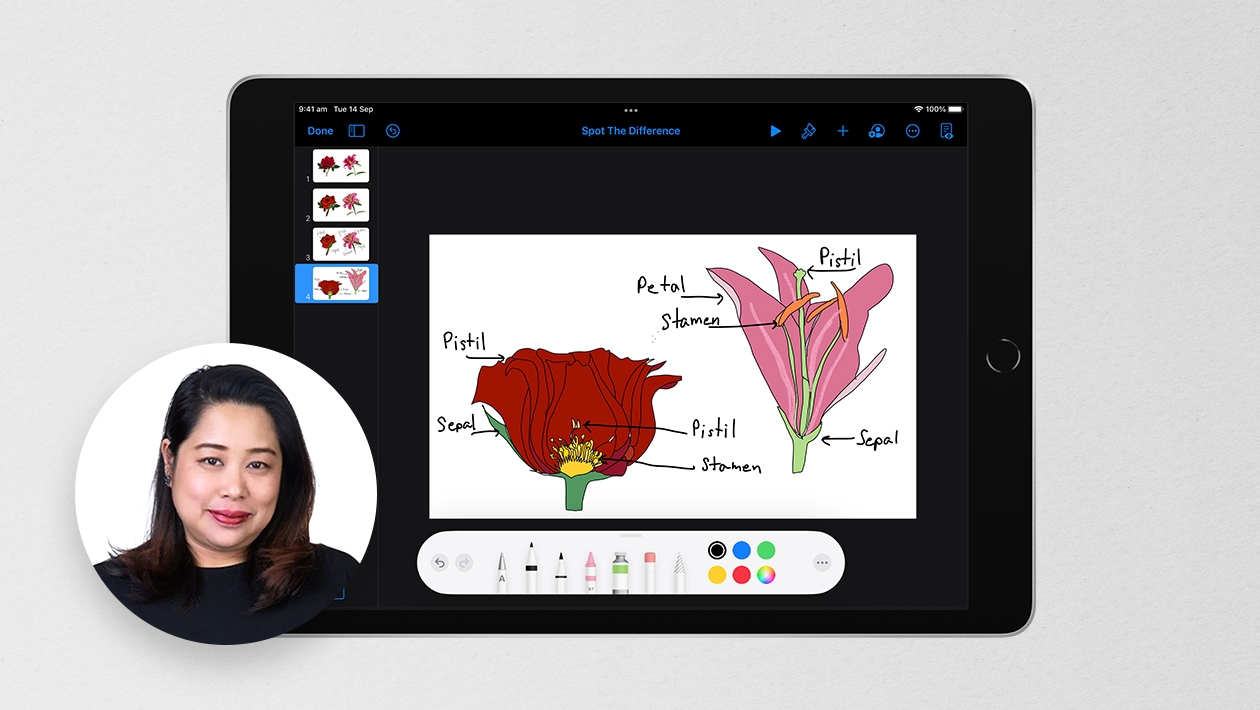
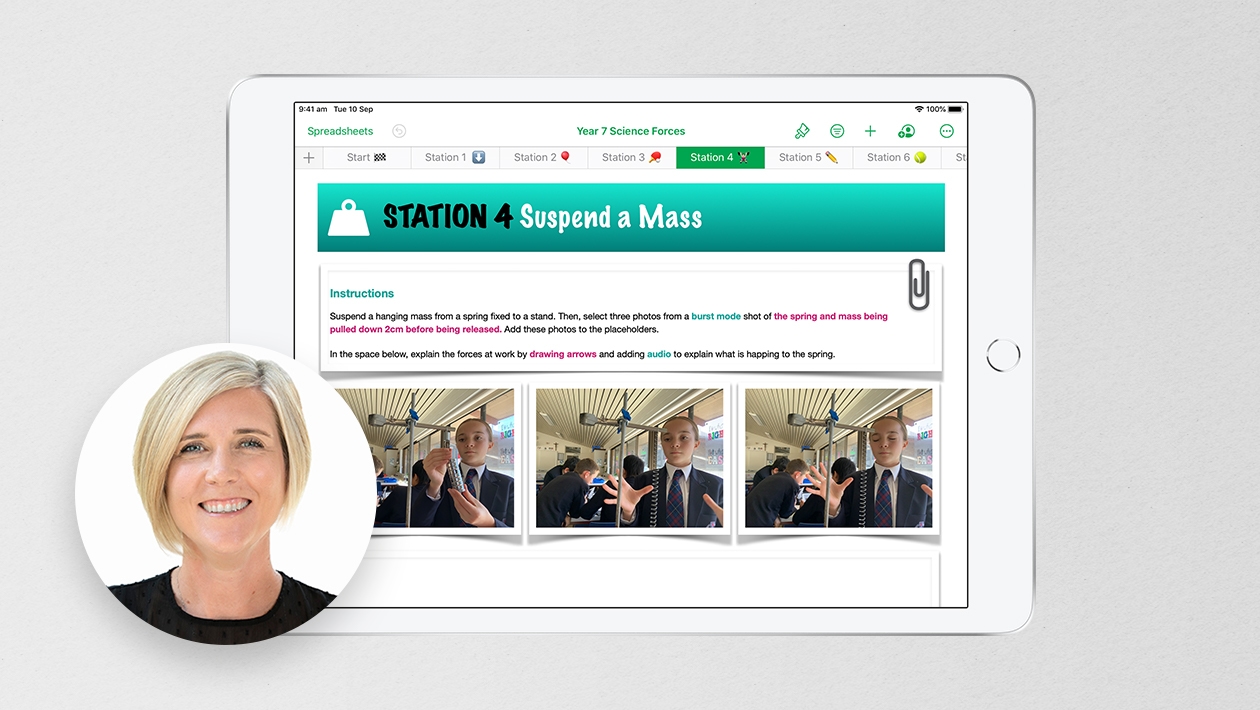
Two biology teachers worked together with the STEM coach and APL Specialist to figure out a way to synthesize a scientific article from NewsELA about the 10% Rule and the Transfer of Energy. The Apple coach suggested using Keynote to create an infographic about the content. Over the course of three days, students read the article, synthesized the information, and developed an infographic that demonstrated their understanding of our topic. Along with the infographic we encouraged students to include audio samples that helped to explain their thinking. Some students needed to use google slides as a result of not having keynote and the results were still outstanding. Attached you will find the rubric that we created (we ended up omitting the 3 blocks of information due to time) and a few samples. #transformingtorringtontogether


October 20, 2023 . English
Nice! I really like the idea of having students create an infographic to explain the topic and also adding audio! Perfect for visual learning as well as being able to explain and describe the process with voice. A great way to “show what you know.” Thanks!
This action is unavailable while under moderation.
This action is unavailable while under moderation.