I was at the library with my kids when I saw this book published by DK called 'Our World in Numbers' I was struck by how interesting the pages looked and also intrigued by the use of numbers as the base for the information.
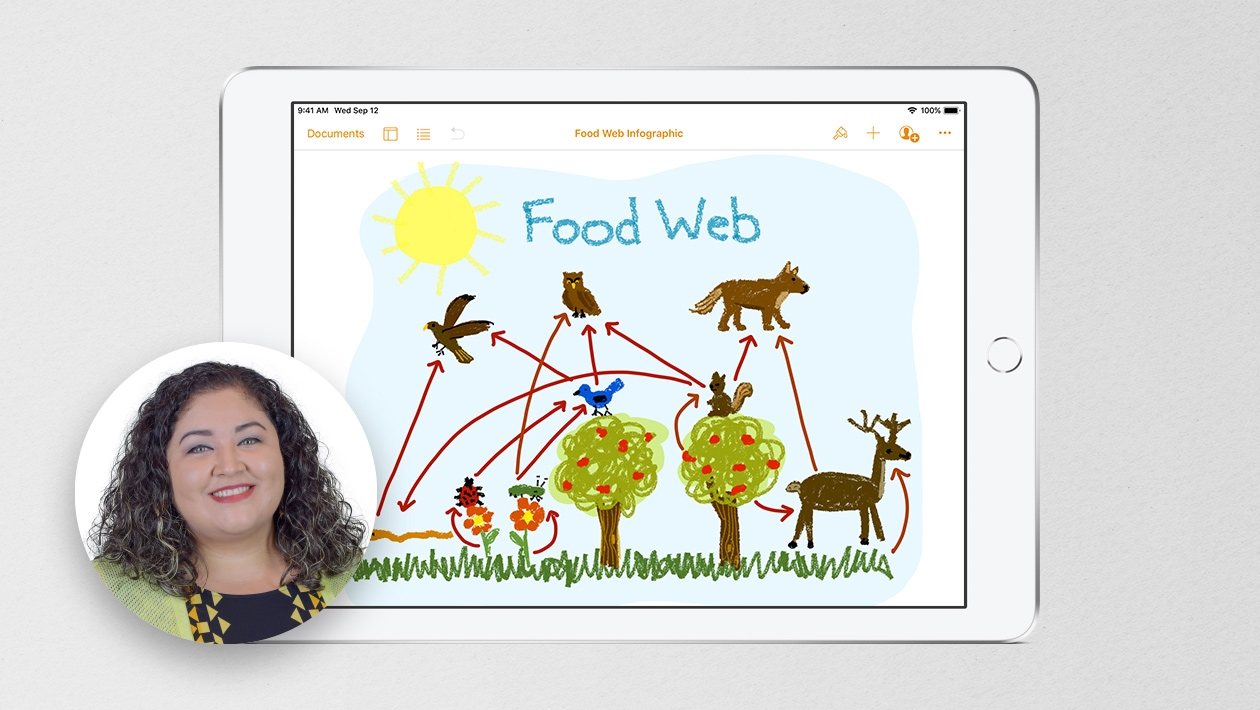
I love infographics and thought this was a nice twist on it. It also thought it would make a great project for our students and an interesting and engaging way for them to present their learning. With that in mind I put together this infographic as an example. I have included a step by step tutorial here from finding and sorting the information to presenting and sharing it.
Feel free to use as you see fit.


February 14, 2023 . English
Love your giraffe! Thanks for the tutorial. Infographic building is an important skill for learners to show what they know and to communicate with data!
This action is unavailable while under moderation.
This action is unavailable while under moderation.